

Network monitoring is one of the most important disciplines in IT operations because it helps teams see what is happening across devices, traffic, services, and connections before users feel the impact. When done well, network monitoring improves visibility, reduces downtime, and supports faster troubleshooting.
A lot of “the network feels worse” reports are not about raw bandwidth at all. They come from timing variation that breaks real-time flows, even when links look healthy on paper. This breakdown of network jitter and why it matters is a useful reference before you start tuning thresholds, because it explains what teams are actually measuring when users complain about choppy voice, video, or gaming sessions.
In practice, network monitoring is not just about checking whether a router is online. It also includes performance monitoring, uptime tracking, and network analytics so teams can understand trends, detect anomalies, and act quickly when something changes. Modern monitoring software turns raw data into alerts, dashboards, and reports.
If you want better results with network monitoring, you need the right mix of tools, metrics, processes, and response workflows. That means choosing suitable network monitoring tools, defining thresholds, and monitoring continuously instead of reacting only after a failure happens.
This guide explains how network monitoring works, which techniques matter most, what metrics to track, and how to build a practical monitoring strategy for real-world environments.
What is network monitoring?
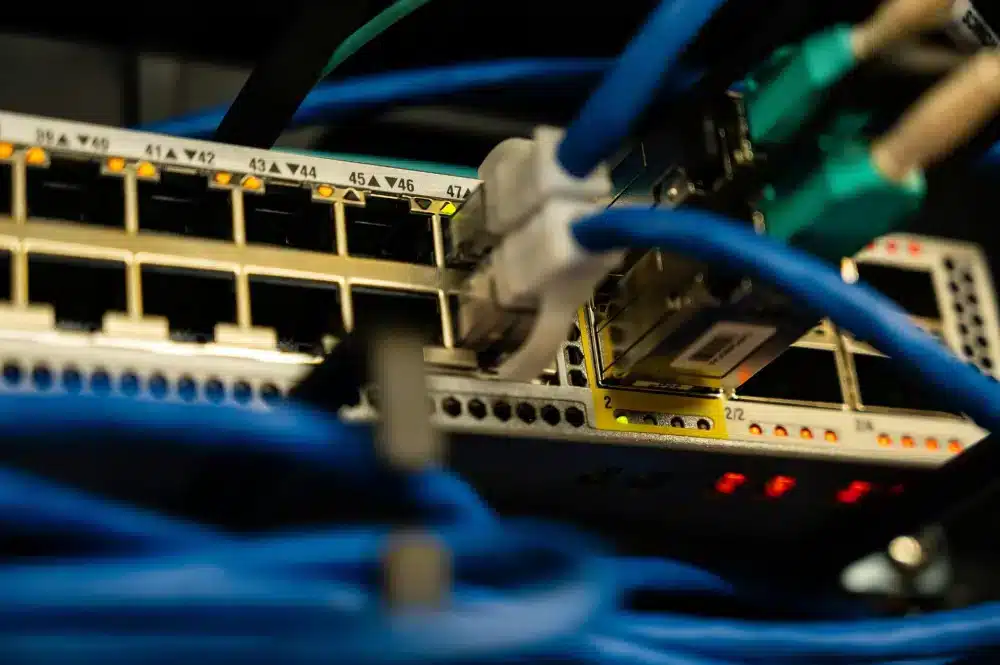
Network monitoring is the continuous observation of a network’s health, availability, traffic, and performance. It helps IT teams identify slowdowns, outages, bottlenecks, and suspicious behavior early, so they can fix problems before they become larger incidents.
If you want a neutral, high-level definition to align terminology across teams, a quick reference helps. The network monitoring overview article summarizes how the concept is typically described and categorized. It is a simple way to make sure everyone is using the same baseline language before you get into tooling choices.
In simple terms, network monitoring answers questions like:
- Is the network up?
- Are devices responding?
- Is traffic normal?
- Are users experiencing delays?
- Is packet loss increasing?
- Did anything change that could affect reliability?
A complete approach usually combines:
- Device monitoring (routers, switches, firewalls, access points)
- Link and bandwidth monitoring
- Service and port monitoring
- Flow analysis
- Log correlation
- Alerting and reporting
Without network monitoring, teams often troubleshoot blindly. They may know users are complaining, but they cannot quickly see whether the root cause is congestion, a failed interface, DNS latency, packet loss, or a misconfiguration.
Why network monitoring matters now
Modern environments are more complex than before. Teams now manage on-prem systems, cloud services, VPNs, remote users, SaaS dependencies, and third-party providers at the same time.
That complexity creates more blind spots.
Because of that, network monitoring is no longer optional for teams that care about reliability, user experience, and operational speed.
What network monitoring includes day to day
A mature network monitoring workflow usually includes:
- Data collection from devices and services
- Baseline creation (what “normal” looks like)
- Thresholds and anomaly detection
- Alert routing and escalation
- Incident response
- Reporting and optimization
This is where network analytics becomes valuable. Instead of seeing only a red/green status, you can identify patterns, recurring failures, traffic spikes, and long-term capacity trends.
What are the best network monitoring tools and techniques?
Choosing the best approach depends on your network size, budget, team maturity, and goals. Some teams need deep packet inspection. Others need simple dashboards and uptime tracking first.
In practice, the strongest setups often combine multiple network monitoring tools rather than relying on a single platform.
Before selecting tools, define your priorities:
- Availability (is it up?)
- User experience (is it fast?)
- Security visibility (is behavior normal?)
- Capacity planning (will it scale?)
- Troubleshooting speed (how fast can you isolate issues?)
Core categories of network monitoring tools
Here are the most common categories of network monitoring tools used by IT and NetOps teams:
- Device and infrastructure monitoring software
Tracks device status, interfaces, CPU, memory, temperature, and link utilization. - Traffic and flow analysis tools
Uses NetFlow, sFlow, or IPFIX to identify who is using bandwidth and where traffic is going. - Packet analysis tools
Useful for protocol-level troubleshooting and deep diagnostics. - Log and event monitoring platforms
Centralizes logs from devices and systems for correlation and alerting. - Synthetic monitoring and uptime checks
Tests services from one or more points to support uptime tracking and detect availability issues quickly. - Application-aware monitoring software
Helps connect network issues with application performance and service behavior.
Flow data becomes a lot easier to interpret when you also understand what the network is built from and how traffic moves between points. This explainer on what a network node is and why it matters gives quick clarity on devices and endpoints in the path, which helps when you are mapping top talkers to real infrastructure. It is especially useful when teams mix up “node,” “device,” and “endpoint” in troubleshooting discussions.
Common examples often used in real environments include Wireshark (packet analysis) and Nagios (availability and status monitoring).
Key techniques that improve results
Tools alone are not enough. You also need techniques that make network monitoring actionable and sustainable.
1) Baseline monitoring
Establish normal ranges for latency, packet loss, bandwidth, and response times. This prevents false alarms and improves anomaly detection.
2) Threshold-based alerting
Create warning and critical thresholds. For example:
- Warning: interface utilization > 70%
- Critical: interface utilization > 90%
3) Trend analysis
Use network analytics to compare current behavior with hourly, daily, and weekly patterns.
4) Root-cause correlation
Correlate alerts (for example: WAN latency spike + packet loss + VPN complaints) to avoid alert storms.
5) Continuous performance monitoring
Performance monitoring should run 24/7, not only during business hours, especially in hybrid environments.
Quick comparison table of monitoring approaches
| Monitoring approach | Best for | Main benefit | Limitation |
| Availability monitoring | Device/service status | Fast outage detection | Limited diagnostic depth |
| Traffic/flow monitoring | Bandwidth visibility | Identifies top talkers/apps | May miss packet-level details |
| Packet analysis | Deep troubleshooting | Precise protocol insights | More complex and time-consuming |
| Log monitoring | Event correlation | Better incident context | Requires normalization/tuning |
| Synthetic checks | User-path validation | Strong for uptime tracking | May not show internal root cause |
How does network monitoring improve performance and security?
Network monitoring improves performance and security because it gives teams visibility before issues become incidents. Instead of waiting for users to report slowness, your team can identify abnormal latency, rising packet loss, or unusual traffic patterns in real time.
This is one of the biggest benefits of combining performance monitoring and network analytics. You are not just observing status. You are using telemetry to make decisions faster and with more confidence.
When teams say “it’s a network issue,” they often mean the behavior at a specific layer or exchange is not happening as expected. Having a shared understanding of how those exchanges work makes your telemetry far more actionable. This explainer on what a network protocol is and why it matters helps connect dashboards and alerts to the underlying rules that traffic is supposed to follow.
Performance benefits of network monitoring
When implemented correctly, network monitoring supports performance in several ways:
- Faster detection of bottlenecks
Congested links, overloaded devices, and saturated WAN connections become easier to spot. - Improved troubleshooting time (MTTR)
Dashboards and historical data reduce guesswork. - Capacity planning
Trends show when links, devices, or services need upgrades. - Better user experience
Monitoring latency, jitter, and packet loss helps protect voice, video, and real-time applications. - Reduced downtime impact
Alerts help teams react sooner and minimize disruption.
A practical example: if users report slow access to a cloud app, network monitoring can quickly show whether the issue is local Wi-Fi congestion, ISP latency, DNS delay, or an upstream provider outage.
Security benefits of network monitoring
While network monitoring is not a full replacement for dedicated security tools, it is a strong operational defense layer.
It helps security and IT teams by:
- Detecting unusual traffic spikes
- Spotting unexpected connections or ports
- Identifying repeated failures or unstable links
- Building a baseline of normal behavior
- Supporting incident investigations with logs and timelines
This is where monitoring software with alerting and reporting becomes important. When alerts are tuned correctly, teams can detect suspicious behavior sooner and verify whether an event is operational, malicious, or simply a configuration issue.
Performance and security use the same foundation
The same telemetry can support both goals:
- Latency and packet loss help with performance monitoring
- Connection patterns and flow anomalies support network analytics
- Availability checks power uptime tracking
- Device telemetry strengthens operational resilience
That is why strong network monitoring tools are often part of broader observability and security workflows.
Which metrics should you track for network health?
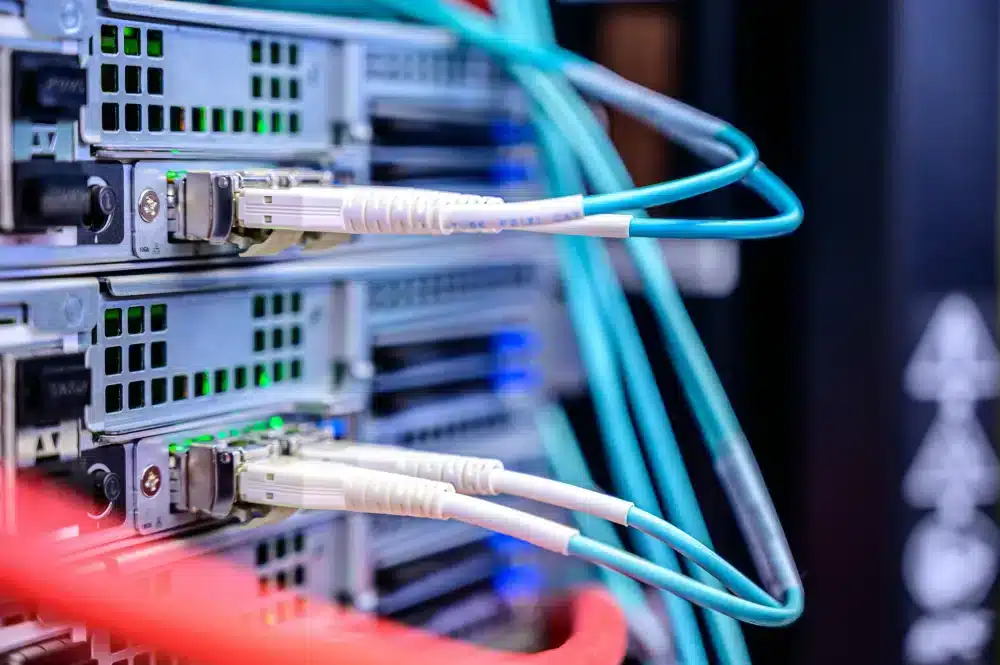
Metrics are the backbone of network monitoring. If you track the wrong data, your dashboards may look busy but still be unhelpful. The best strategy is to monitor a focused set of metrics first, then expand as your team matures.
Below is a practical list of the most important metrics for network monitoring, especially when the goal is better reliability and performance monitoring.
Core network performance metrics
Start with these metrics in every environment:
- Bandwidth utilization
Shows how much capacity is being used on links and interfaces. - Latency
Measures delay between endpoints. High latency can affect cloud apps, VoIP, gaming, and remote work sessions. - Packet loss
Lost packets can cause retransmissions, poor call quality, and unstable sessions. - Jitter
Variation in packet delay, especially important for voice and video traffic. - Throughput
Actual data transfer achieved, not just theoretical capacity. - Error rates / discards
Interface errors can reveal hardware issues, duplex mismatches, or cable problems.
When packet loss shows up, the key is to translate it into user impact instead of treating it like a vague red flag. The packet loss overview reference is handy for grounding the concept in plain terms, including why retransmissions and timeouts happen. That makes it easier to explain why “the service is up” can still feel unusable.
These metrics form the foundation for performance monitoring and are essential for diagnosing user complaints.
Availability and device health metrics
You also need operational metrics to support uptime tracking and infrastructure stability:
- Uptime / downtime
- Interface status (up/down/flapping)
- Device CPU usage
- Device memory usage
- Temperature / power (when available)
- Number of active sessions or connections
- Service response time (DNS, DHCP, VPN, web gateways, etc.)
These metrics help answer two critical questions:
- Is the network available?
- Is it healthy enough to remain available?
Recommended metric checklist (starter set)
Use this checklist if you are standardizing network monitoring quickly:
- Uptime status for critical devices and services
- WAN latency per site
- Packet loss on key paths
- Bandwidth utilization on core links
- Device CPU and memory for network appliances
- Interface errors/discards
- VPN tunnel availability
- DNS response time
- Alert noise review (weekly)
- Trend report for capacity planning (monthly)
With this setup, your network analytics becomes much more useful because the data is consistent and tied to operational decisions.
What are the best practices for real-time network monitoring?
Real-time network monitoring is not just about live dashboards. It is about building a system that detects issues early, routes alerts correctly, and supports fast action without overwhelming the team.
Many teams fail here because they collect too much data but do not define process rules. The result is alert fatigue, noisy dashboards, and slow response.
Alerting, dashboards, and automation best practices
Here are the most effective practices for real-time network monitoring:
1) Use tiered alerts
Create severity levels such as:
- Info
- Warning
- Critical
This reduces noise and improves prioritization.
2) Build role-specific dashboards
Not everyone needs the same view.
- NOC teams: current alarms and availability
- Network engineers: interfaces, latency, packet loss, config changes
- Managers: uptime trends, SLA impact, incident summaries
3) Automate repetitive responses
For common issues, automation can:
- Restart services
- Open tickets
- Trigger scripts
- Notify the correct on-call person
This makes monitoring software more than a passive reporting tool.
4) Add maintenance windows
Suppress alerts during planned changes to avoid false incidents.
5) Review thresholds regularly
As traffic grows, thresholds should evolve. Static values quickly become outdated.
Process best practices teams often ignore
Even strong network monitoring tools fail without process discipline. Focus on these habits:
- Create escalation paths
Define ownership clearly. Who responds to WAN alerts? Who handles access layer issues? - Document common fixes
Build a runbook for repeated incidents. - Track MTTR and alert quality
Improve the monitoring process itself, not only the network. - Test alert delivery
An alert that never reaches the team is useless. - Correlate telemetry with user reports
Compare data with ticket patterns to validate baselines.
When these practices are in place, network monitoring becomes a proactive operational system instead of a reactive dashboard.
How can ExitLag support network monitoring and connection stability?
ExitLag is not a replacement for enterprise network monitoring tools, but it can be a practical complementary solution when your use case includes route instability, latency variation, packet loss, or poor path quality in real-time applications, especially gaming and other latency-sensitive traffic.
In other words, your network monitoring stack tells you what is happening (latency spikes, jitter, packet loss), while ExitLag can help improve the traffic path experience in supported scenarios by optimizing routing behavior and stabilizing connection quality for end users.
How ExitLag complements performance monitoring
If your team monitors performance for online games, live services, or real-time user sessions, ExitLag can support your performance monitoring efforts by helping reduce issues caused by unstable routes rather than local hardware failures.
This is useful when your metrics show:
- Intermittent packet loss
- Jitter spikes during peak times
- Regional route instability
- ISP path inconsistency
- Higher latency on specific routes
In those cases, your network analytics may reveal the pattern, and ExitLag becomes part of a practical response strategy for improving user experience.
When to mention ExitLag in a monitoring workflow
You should mention ExitLag in content or operations playbooks when:
- You support gaming-focused environments
- You troubleshoot connection quality, not only uptime
- You need a user-side solution for route optimization
- You want to complement uptime tracking with experience-focused optimization
That combination matters because “service is up” does not always mean “service feels good.” A connection can be available and still perform badly due to routing conditions.
If your goal is better real-time stability, use network monitoring to detect the issue and ExitLag to help mitigate route-related performance problems where applicable.
FAQ
Network monitoring focuses on observing health, availability, traffic, and performance. Network management is broader and includes configuration, provisioning, policy control, and lifecycle operations. Monitoring is a core part of management, but not the whole process.
The most important starting metrics are latency, packet loss, bandwidth utilization, uptime, interface status, and device CPU/memory. These support both performance monitoring and uptime tracking and provide a strong baseline for troubleshooting.
They can be. Many small teams start with free or open-source network monitoring tools for availability checks, basic alerting, and device status. Over time, they often add commercial monitoring software for easier scaling, reporting, automation, and advanced network analytics.
At minimum, review alert thresholds and noise weekly, and review trends monthly. Real-time alerts should be monitored continuously for critical services. Regular tuning is essential to keep network monitoring useful and avoid alert fatigue.
No. Uptime tracking is necessary, but it only tells you whether something is reachable. You also need performance monitoring (latency, packet loss, jitter) and network analytics to understand quality, trends, and root causes.
No. ExitLag is best seen as a complementary solution for connection path optimization in supported scenarios, especially for latency-sensitive traffic. Enterprise network monitoring and monitoring software are still required for infrastructure visibility, alerting, and operational control.
Final thoughts

Strong network monitoring is not about collecting every possible metric. It is about collecting the right metrics, using the right network monitoring tools, and building a process that helps your team respond faster and smarter. When you combine performance monitoring, uptime tracking, and network analytics with clear alerting and runbooks, you improve reliability, security visibility, and user experience.
Ready to improve your connection stability and monitor real-time performance more effectively? network monitoring helps you identify the problem, and ExitLag can help optimize supported traffic routes to reduce latency, packet loss, and jitter in daily use. Try ExitLag and see how better routing can improve your experience.
Got questions or want to connect with other players? Join the conversation at the ExitLag Forum!